Tools
Tool to get plate configuration data on an arbitrary cross-section. (Please feel free to download.)
Sample
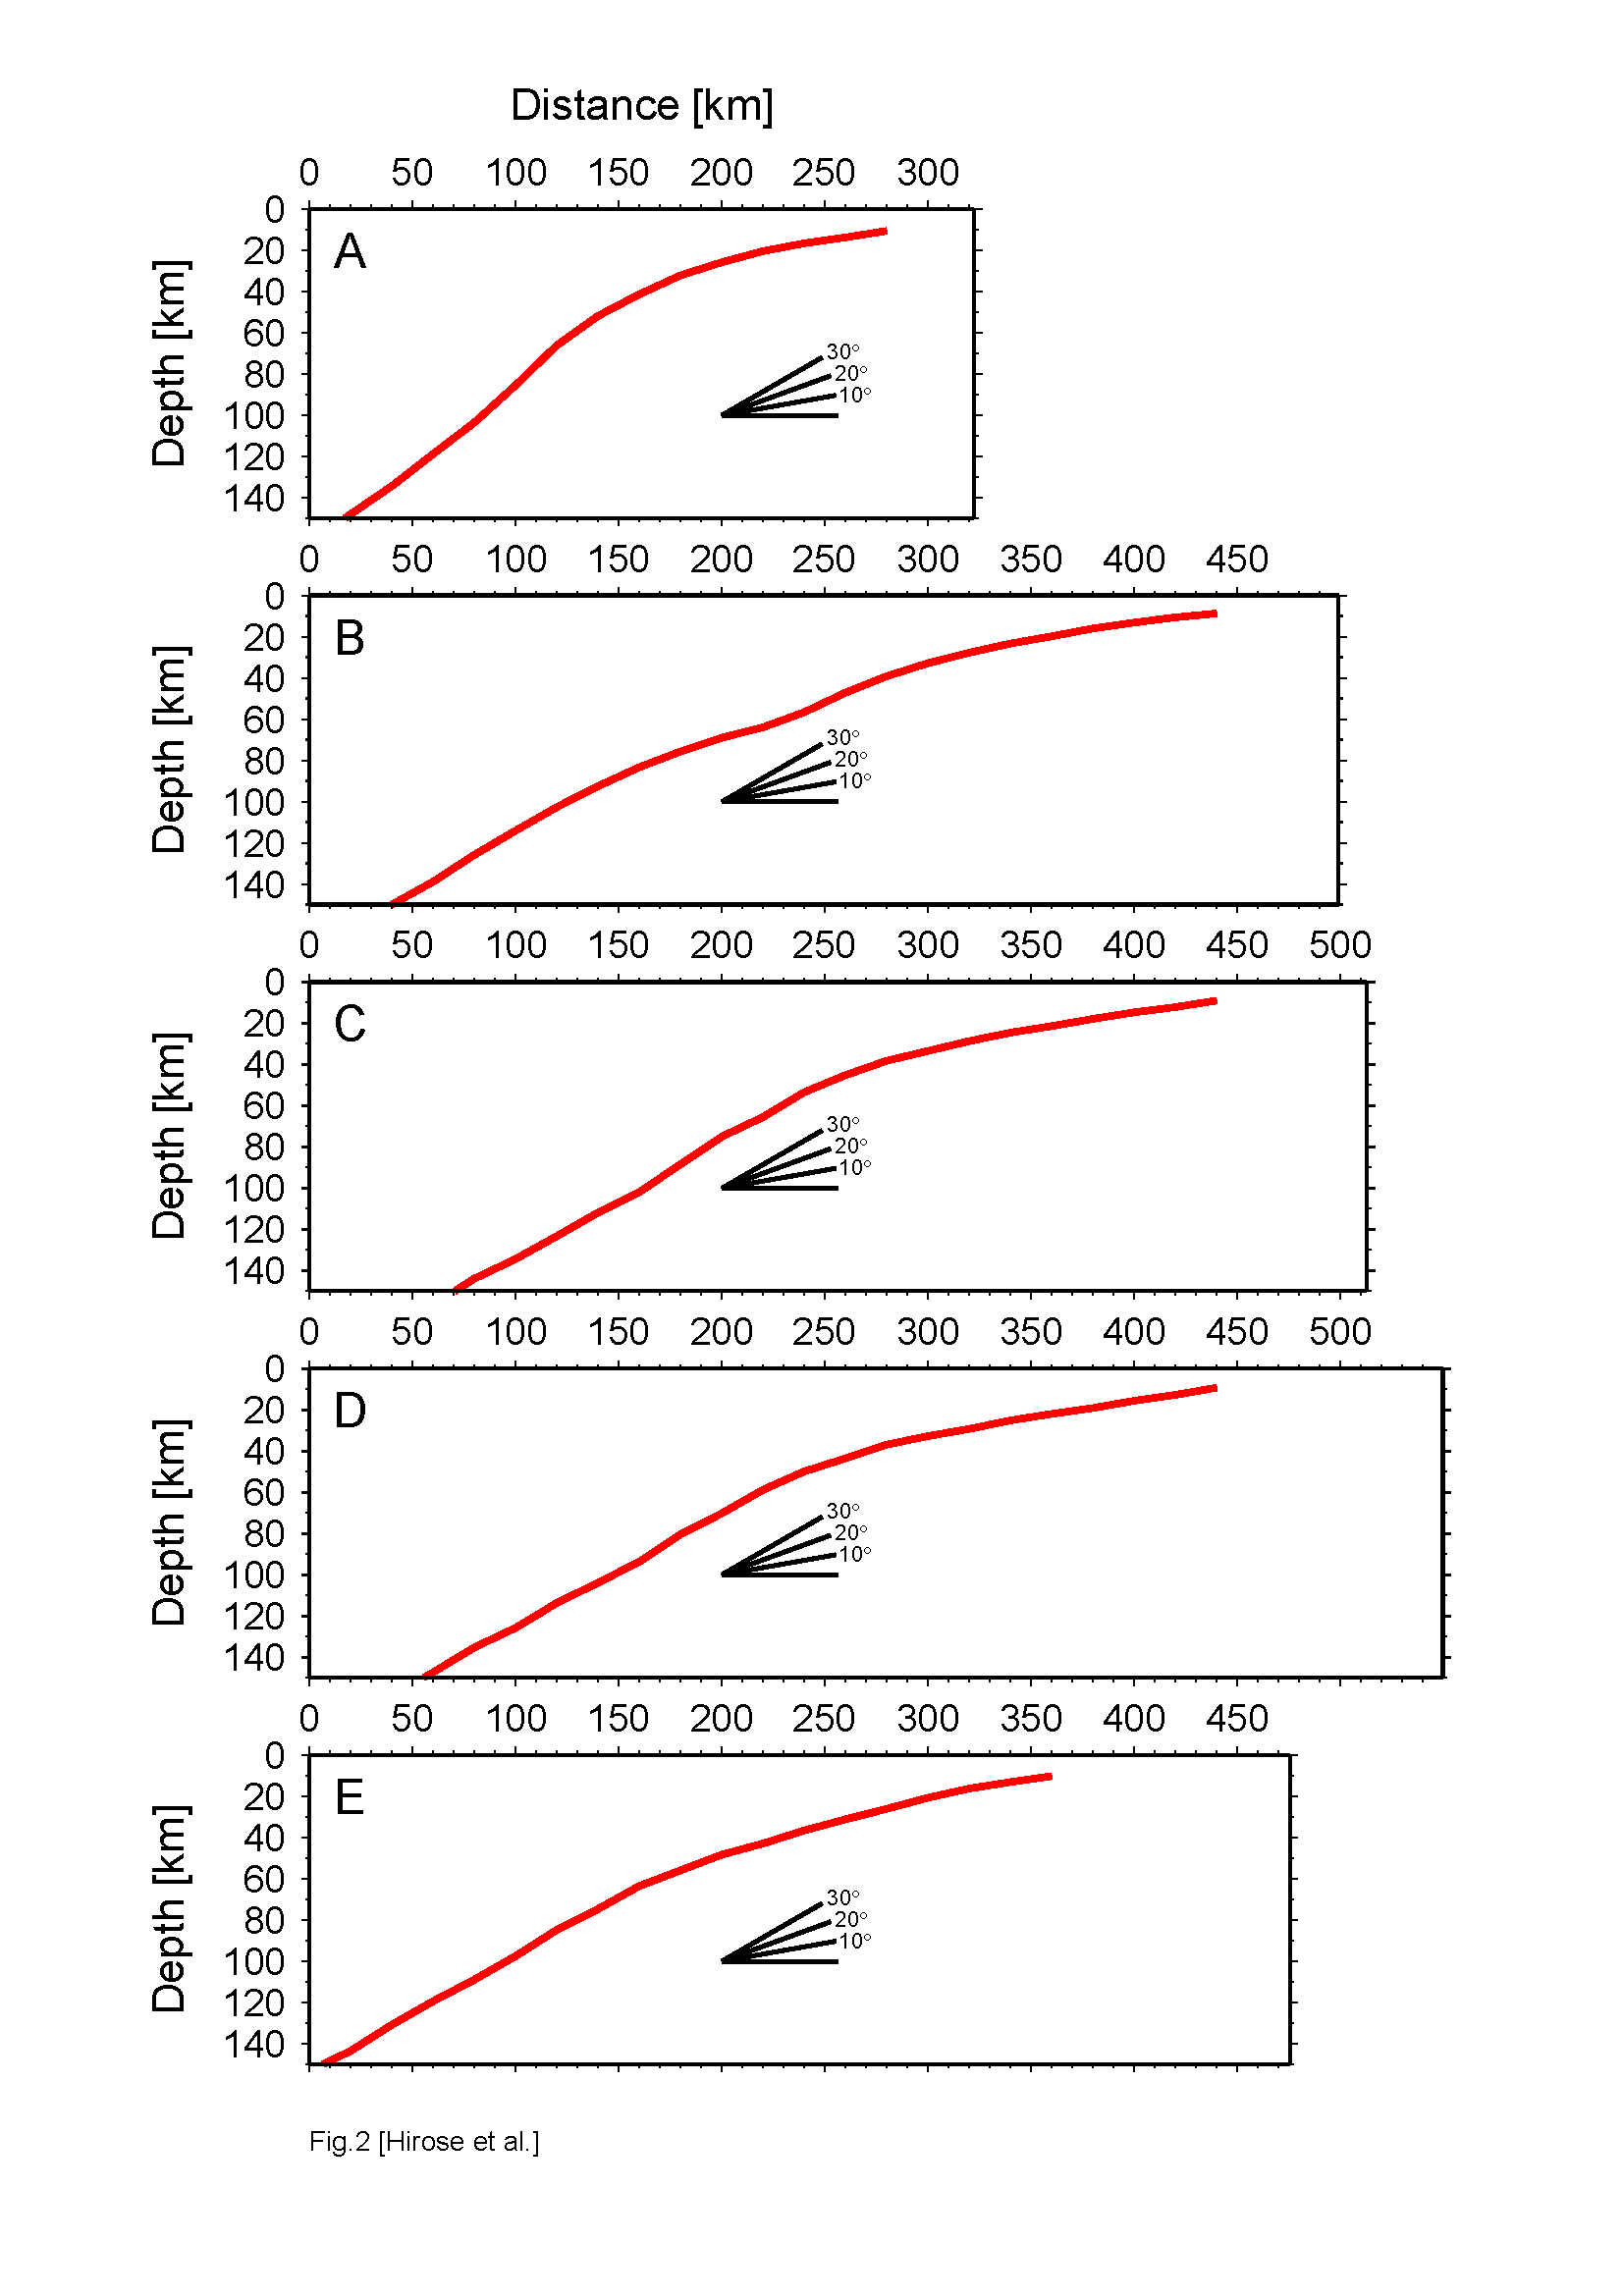
Cross-section along lines A-E based on data extracted by the tools.
Procedure
1. By downloading & decompressing data file (get_cross_section.tar.gz), "get_cross_section" folder is made.
*Note: I'll introduce how to get a cross-section data of the Pacific plate (PAC). If you would like to get that of the Philippine Sea plate (PHS), please replace PAC with PHS in following explanation.
2. Please set two points (longitude and latitude), and interval distance in the parameter file "PAC_project.prm" for projection.
	---
	140.0	37.0	#[lon1, lat1]
	143.5	36.0	#[lon2, lat2]
	20.0		#[distance (km)]
	---
3. By using "PAC_1_make_grids.sh", Pacific plate data (PAC_plate.dat) are interpolated every 0.05 degrees.
*Note: In this way, data are interpolated even in areas that have no data. Therefore, please refer to PAC and make sure that there are iso-depth contour data in areas.
*: Output file is "plate_depth.out".
*: Figure is "plate_PAC_mesh.ps".
*: You can change a grid interval by the variable "ii" in the shell script.
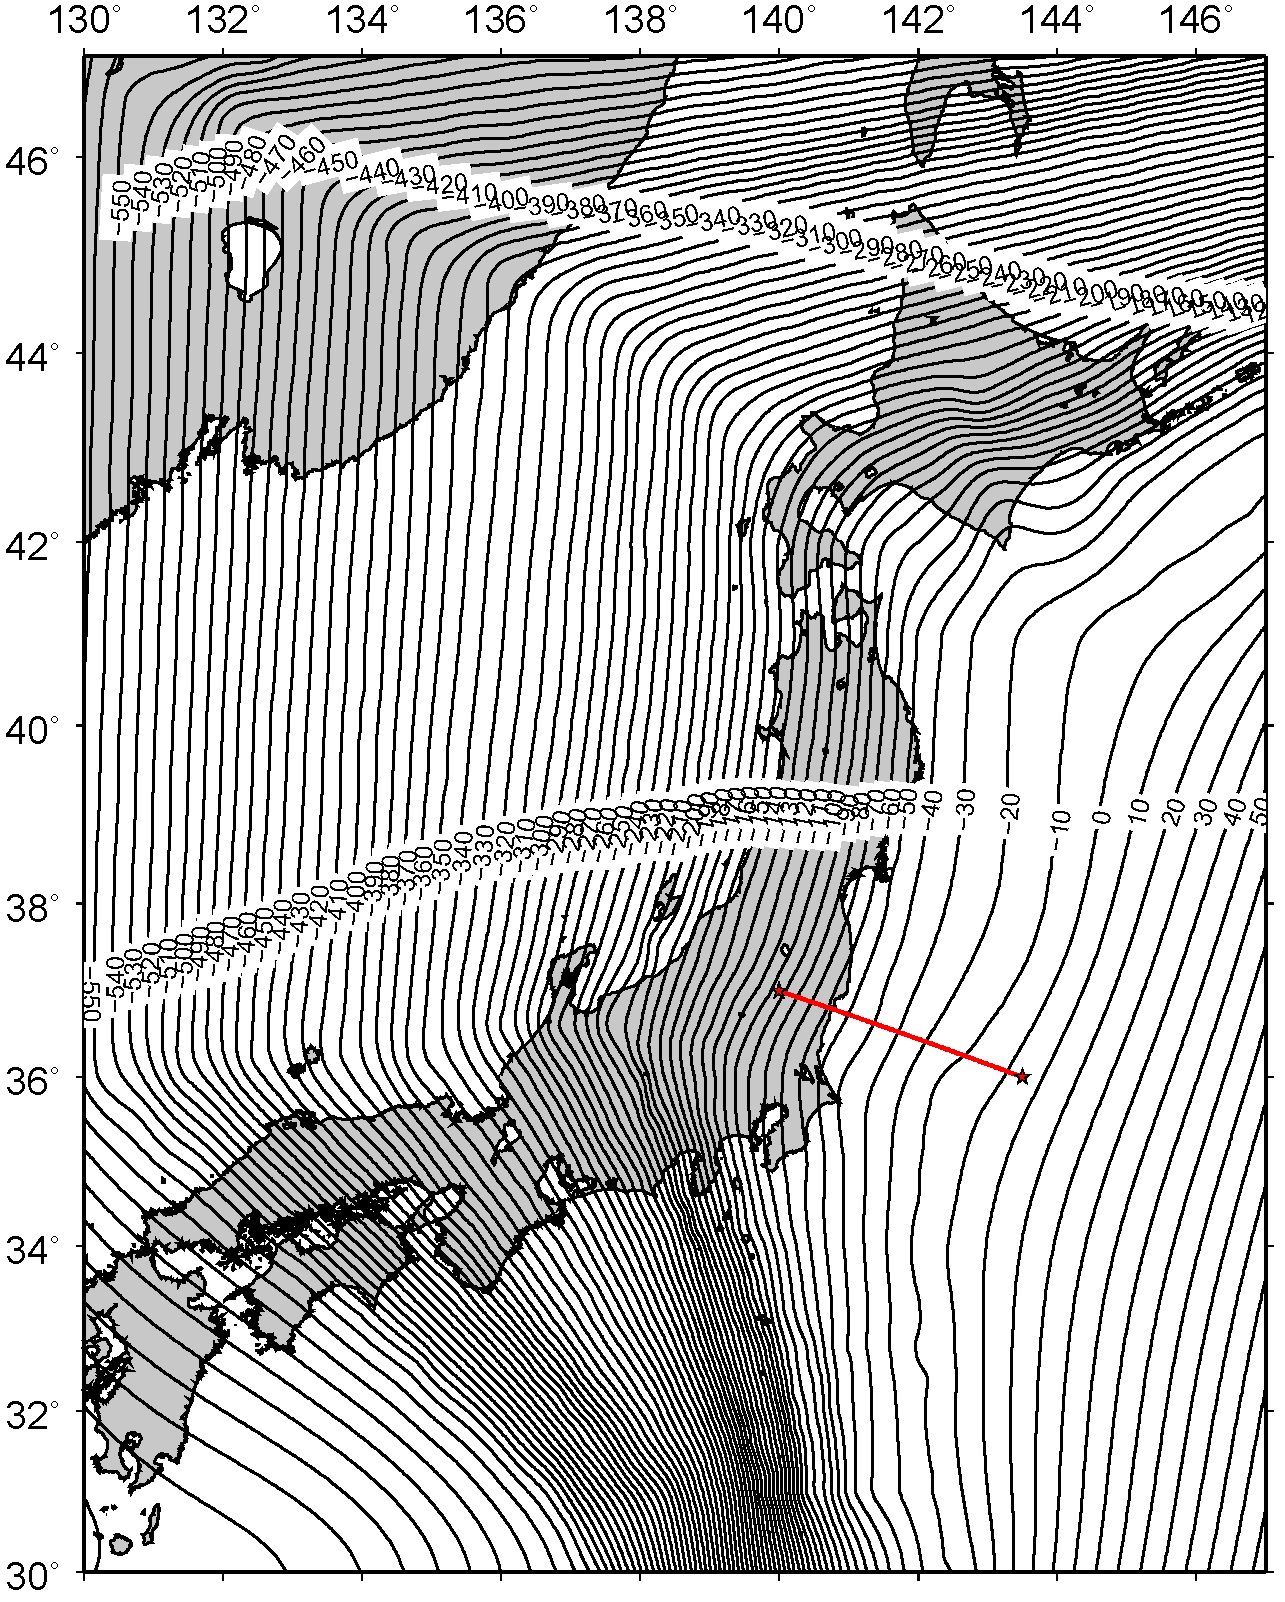
Figure 1. Pacific plate configuration interpolated every 0.05 degrees.
Red line indicates the projection line set in the step 2.
4. By using "PAC_2_make_project.sh", you can get data of longitude, latitude, and depth along the arc set in the step 2.
*: In this case, data are sampled every 20 km along the arc that connects E140.0, N37.0 and E143.5, N36.0.
*: Output file is "project.out".
	---
	Lon	Lat	Distance [km]
	140	37	0
	140.213	36.9427	20
	140.426	36.885	40
	140.639	36.8269	60
	140.852	36.7684	80
	141.064	36.7096	100
	141.275	36.6504	120
	141.487	36.5908	140
	141.698	36.5308	160
	141.909	36.4705	180
	142.119	36.4098	200
	142.329	36.3487	220
	142.539	36.2873	240
	142.749	36.2255	260
	142.958	36.1633	280
	143.167	36.1008	300
	143.375	36.0379	320
	143.5	36	331.995
	---
5. By using "PAC_3_make_cross_data.sh", you can get a cross-section figure.
*: Output file is "cross_data.out".
*: Figure is "cross_section_PAC.ps".
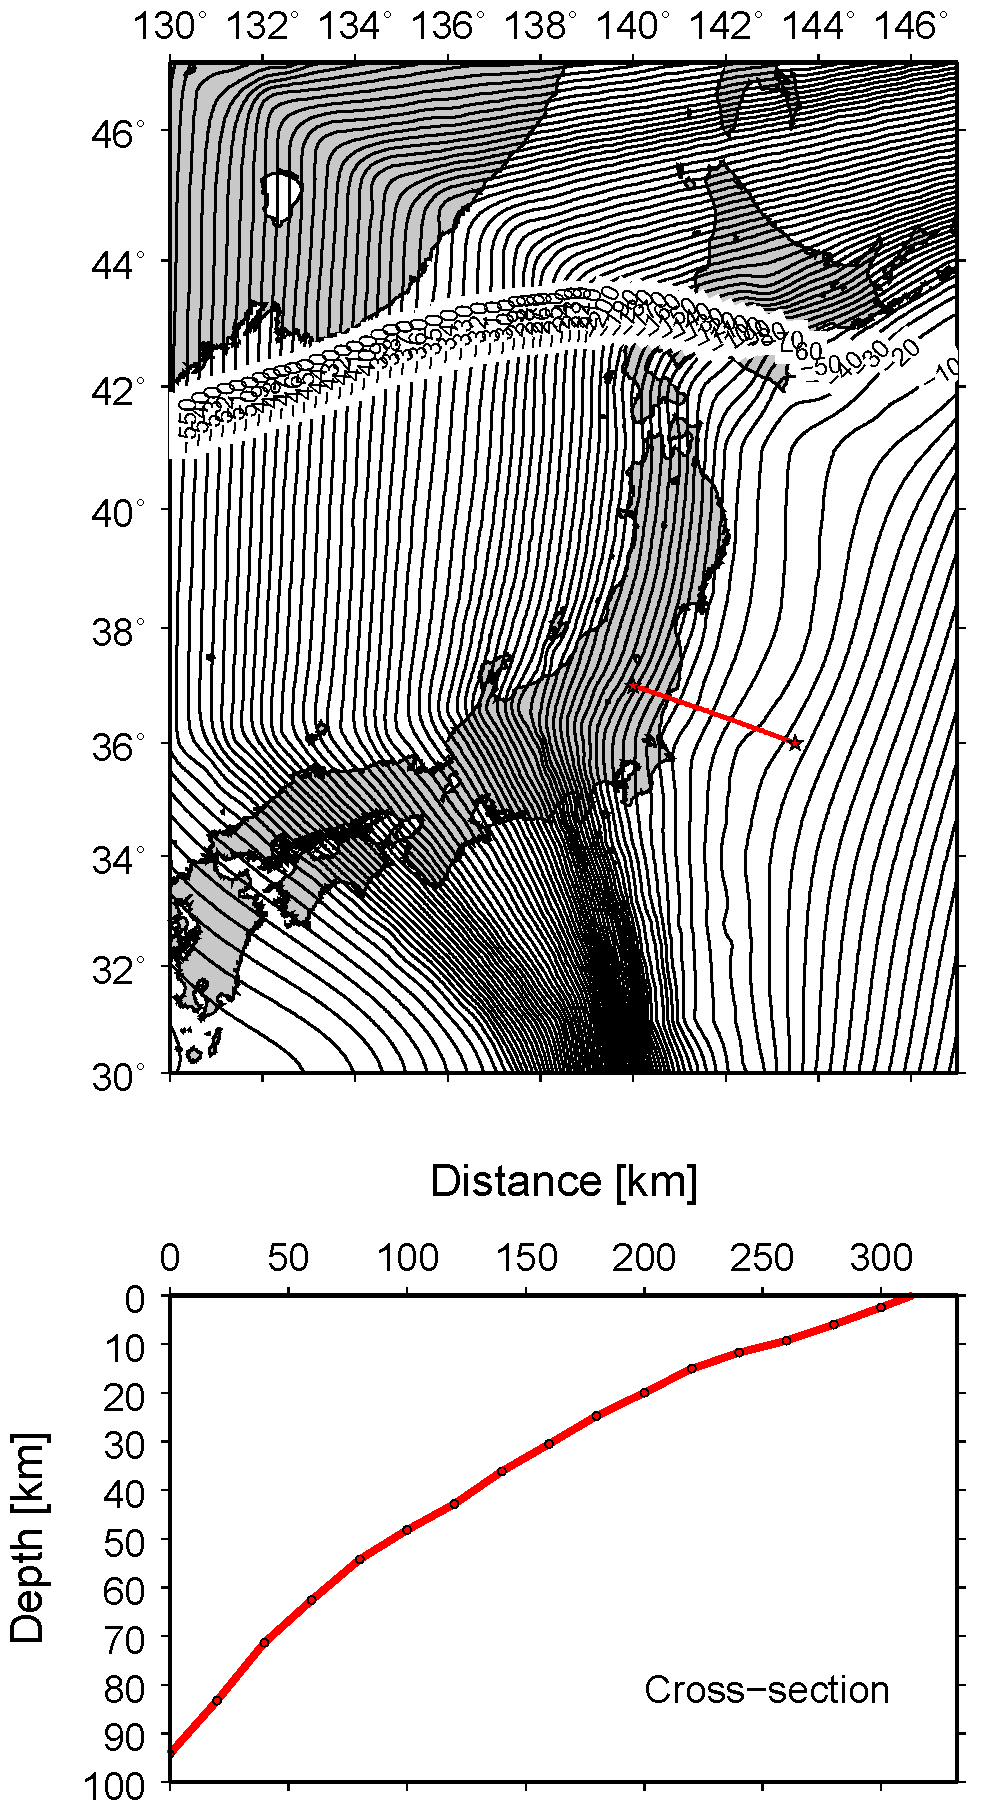
Figure 2. Cross-section along the red line on the map.
Dist and Depth in following list are used.
	---
	Lon1     Lat1	   Dist   Lon2     Lat2     Depth [km]
	140.0000 37.0000    0.00  140.0000 37.0000  -94.22
	140.2130 36.9427   20.00  140.2000 36.9500  -83.28
	140.4260 36.8850   40.00  140.4500 36.9000  -71.34
	140.6390 36.8269   60.00  140.6500 36.8500  -62.66
	140.8520 36.7684   80.00  140.8500 36.7500  -54.22
	141.0640 36.7096  100.00  141.0500 36.7000  -48.23
	141.2750 36.6504  120.00  141.2500 36.6500  -42.93
	141.4870 36.5908  140.00  141.5000 36.6000  -36.22
	141.6980 36.5308  160.00  141.7000 36.5500  -30.60
	141.9090 36.4705  180.00  141.9000 36.4500  -24.78
	142.1190 36.4098  200.00  142.1000 36.4000  -20.05
	142.3290 36.3487  220.00  142.3500 36.3500  -15.05
	142.5390 36.2873  240.00  142.5500 36.3000  -11.72
	142.7490 36.2255  260.00  142.7500 36.2500   -9.24
	142.9580 36.1633  280.00  142.9500 36.1500   -5.96
	143.1670 36.1008  300.00  143.1500 36.1000   -2.50
	143.3750 36.0379  320.00  143.3500 36.0500    1.32
	143.5000 36.0000  331.99  143.5000 36.0000    4.49
	---
*: Lon1, Lat1, and Dist are the same as that of the step 4.
*: Lon2 and Lat2 indicate the nearest grids to Lon1 and Lat2 among grids interpolated every "ii (e.g., 0.05 degrees)" in the step 3.
*: Depth indicates the depth in Lon2 and Lat2.
Therefore, if Lon2 (or Lat2) is very different from Lon1 (or Lat1),
you should change variables "ii" in the step 3 and/or "dgr" in make_cross_data.f used in the step 5 by trial and error.
How to cite
Please specify a source article corresponding to the area precisely when you used this data of plate configuration as follows:
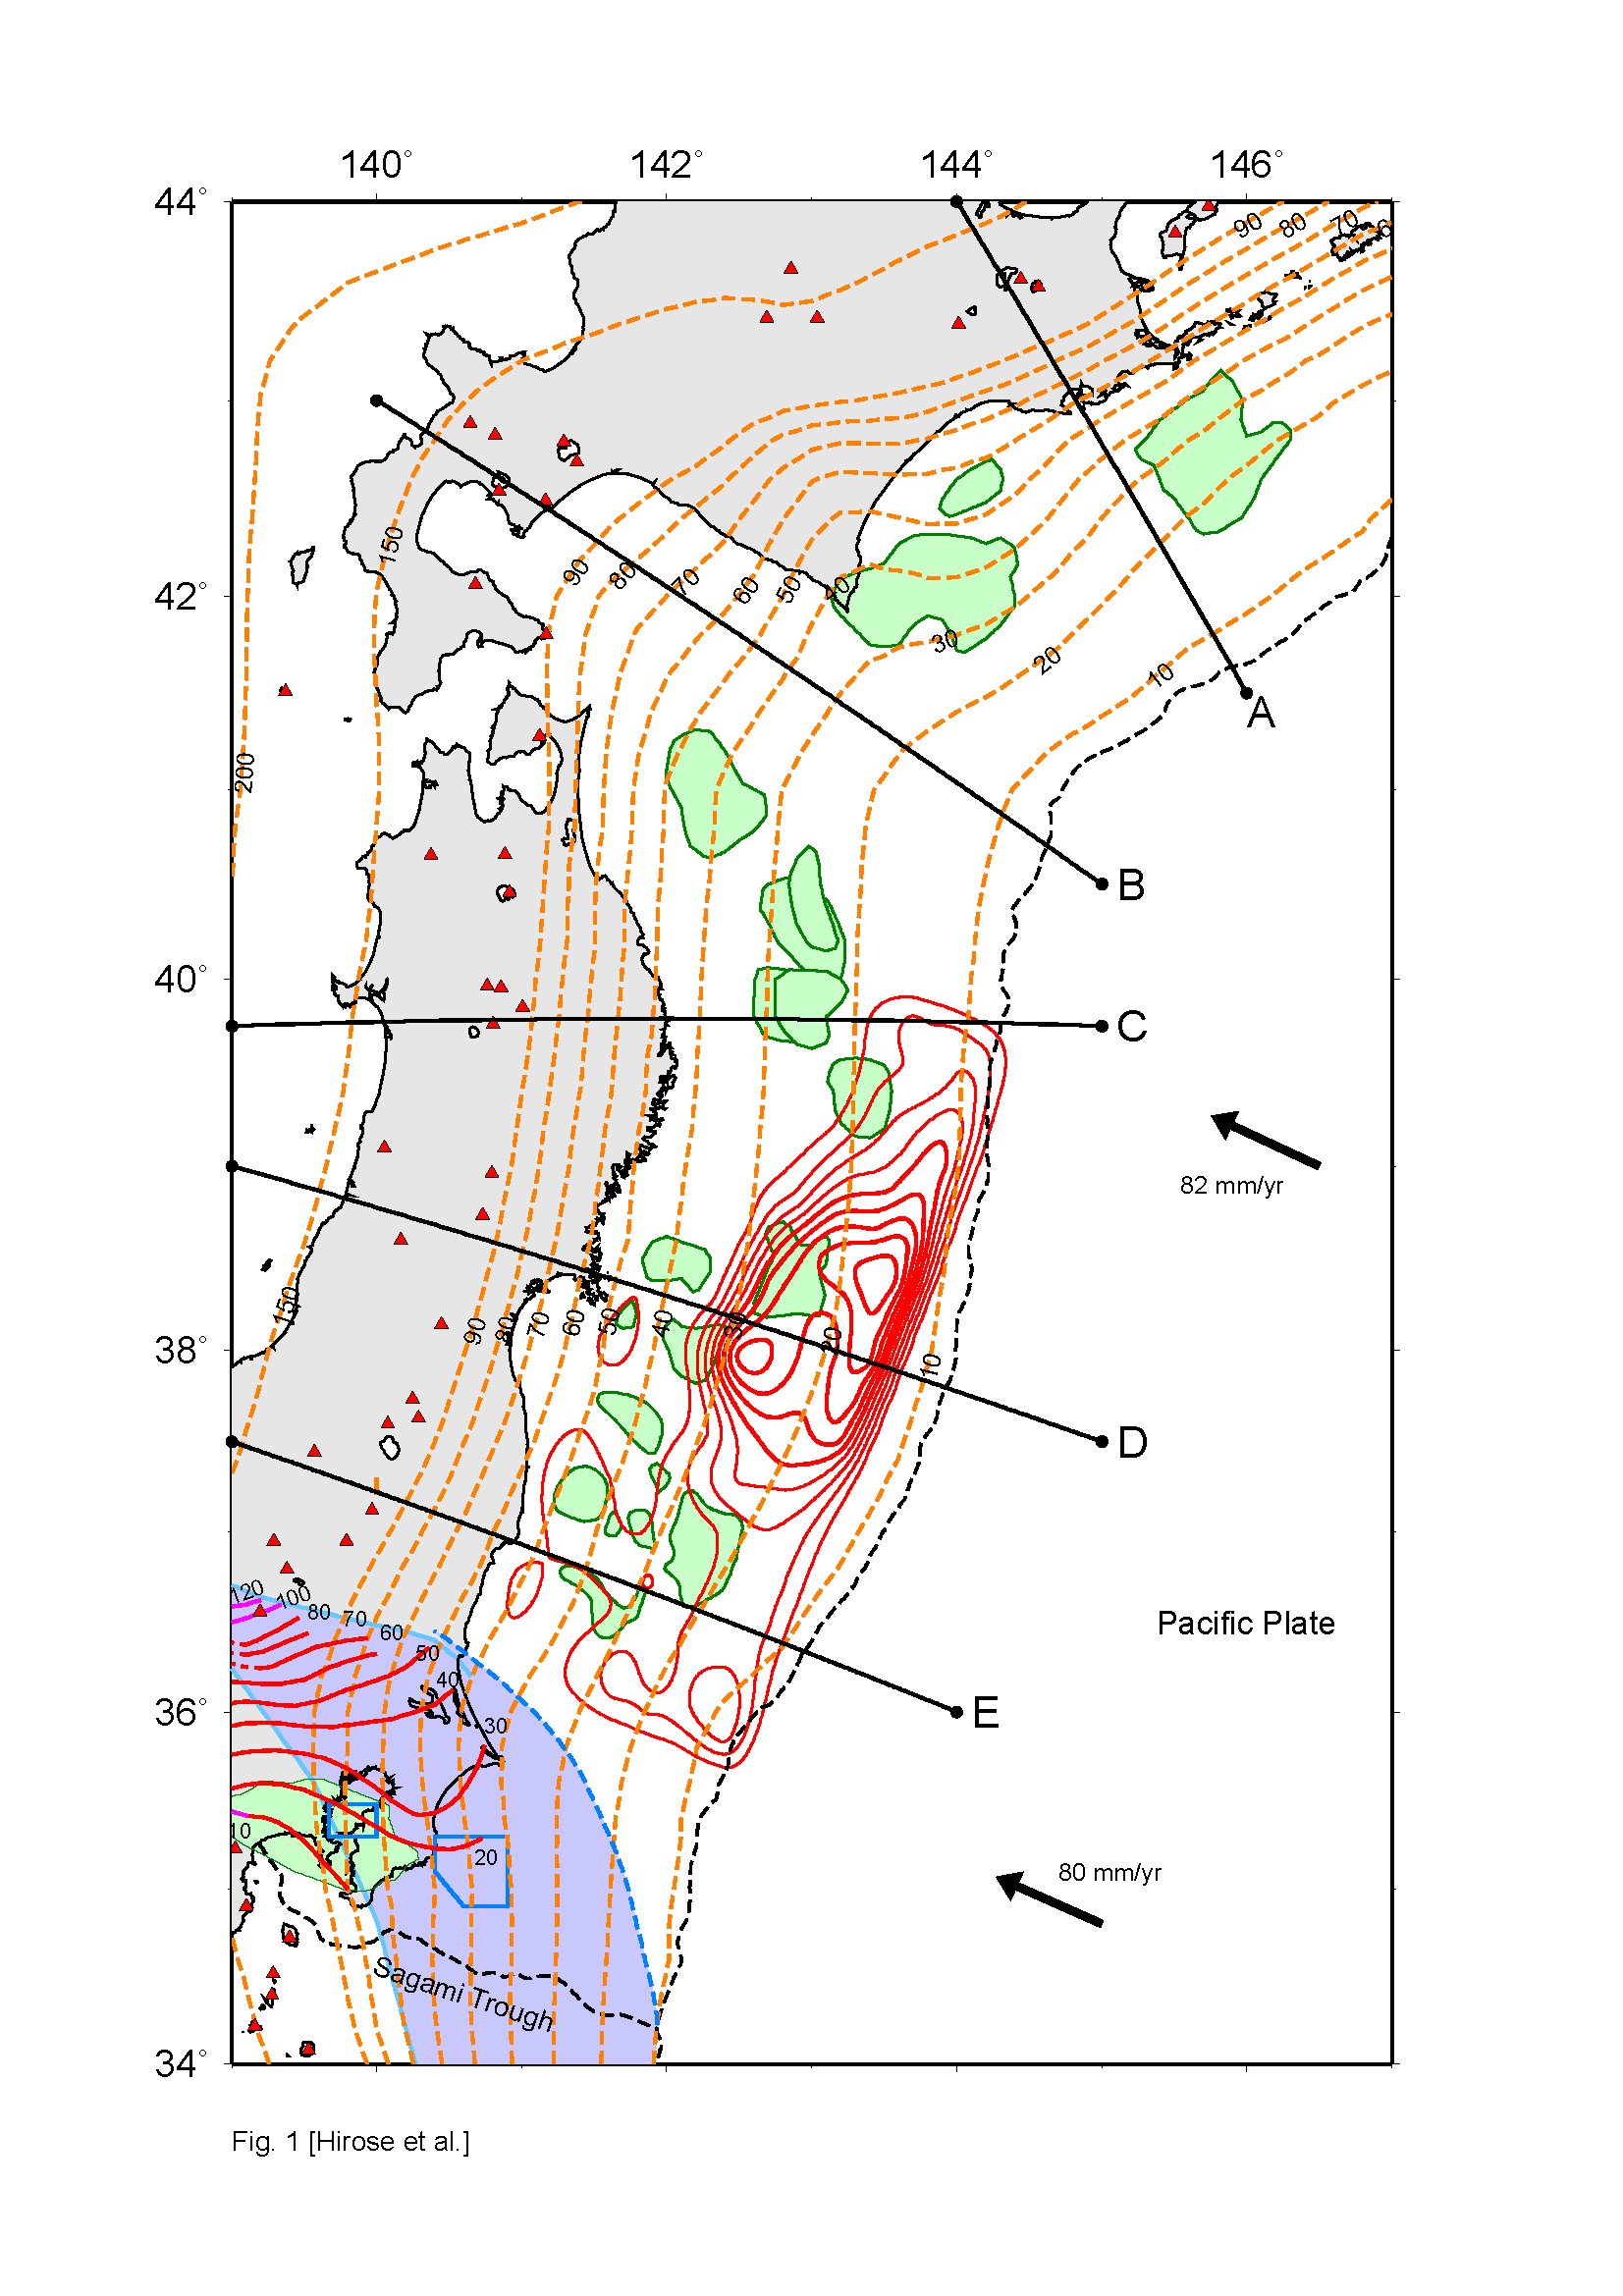
Hokkaido - Tohoku districts:Kita et al. (2010, EPSL); Nakajima and Hasegawa (2006, GRL)
Southern Tohoku - Kanto districts:
Nakajima and Hasegawa (2006, GRL); Hirose et al. (2008, Zisin2); Nakajima et al. (2009, JGR)
Southwestern Japan:
Baba et al. (2002, PEPI); Nakajima and Hasegawa (2007, JGR); Hirose et al. (2008, JGR)