Major Writings
<< Future Projection by the models simulating present-day East Asian climatology accurately >>
Future Changes in Summertime East Asian Monthly Precipitation in CMIP5 and Their Dependence on Present-Day Model Climatology (Tomoaki OSE)
<< Interpretation of Future Change in Summertime East Asian Monthly Precipitation >>
Characteristics of Future Changes in Summertime East Asian Monthly Precipitation in MRI-AGCM Global Warming Experiments (Tomoaki OSE)
<< Understanding future precipitation changes during summer in East Asia >>
Future precipitation changes during summer in East Asia and model dependence in high-resolution MRI-AGCM experiments (Tomoaki OSE)
Global warming experiments using high-resolution climate models are important for studying the impact of global warming on human society from region to region. Three different cumulus schemes (YS: Yoshimura, KF: Kain-Fritsch and AS: Arakawa-Schubert) in the high-resolution Meteorological Research Institute AGCM have simulated slightly different future summer mean precipitation changes in East Asia, which are not negligible in the context of regional climate change. Specifically, 25-year mean June-July-August (JJA) average precipitation clearly decreases over eastern Japan, and tends to increase over northern Japan in YS. However, in KF and AS, decreases in precipitation are not significant over Japan, and an increase is clear from central China through southwestern Japan. Addtionally, the increase is extended over the Pacific side of Japan in KF.
The above dependence of future changes in precipitation in East Asia on the scheme used is interpreted by comparing future changes in water and heat balances in the atmosphere. Among possible global warming effects, scheme dependence is attributed to different changes in mean vertical velocity associated with southward shift of the westerly jet over the northern Pacific and weakened Asian monsoon circulations over Eurasia.
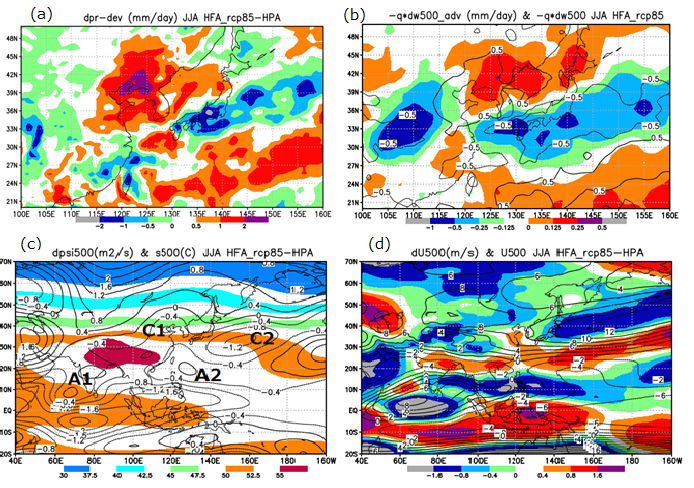
Figure caption: Future precipitation changes during summer in East Asia in 60km-grid MRI-AGCM (YS-scheme version) experiments and associated figures,
(a) Future precipitation changes during summer in East Asia (mm/day),
(b) Future precipitation changes due to the changes in 500hPa vertical velocity (contours: mm/day), and Future precipitation changes due to the changes in 500hPa vertical velocity related with horizontal circulations (colors: mm/day),
(c) Future changes in 500hPa streamfunctions (contours: m2/s), and 500hPa static energy divided by Cp at present climatology (colors: centigrade),
(d) Future changes in 500hPa zonal wind velocity during summer in Asia and the Pacific (colors: m/s), and the same but for present climatology (contours: m/s).
<< An example for future SST change patterns to influence local precipitation changes systematically>>
Uncertainty of Future Precipitation Change Due to Global Warming Associated with Sea Surface Temperature Change in the Tropical Pacific (Tomoaki OSE and Osamu ARAKAWA)
The effects of future tropical Pacific sea surface temperature (SST) changes on regional precipitation projections are statistically studied for December-January-February (DJF) and June-July-August (JJA) in the Coupled Model Intercomparison Project phase 3 (CMIP3) experiments. The present climate precipitation responses to Nino3 SST variability appear as an uncertainty with regards to future regional precipitation changes among the CMIP3 model projections.
Compared with the CMIP3 models projecting La Nina-like Pacific SST changes, the models projecting El Nino-like Pacific SST changes tend to simulate more precipitation in future DJF over the tropical central Pacific, southeastern North America and the tropical western Indian Ocean, and less over the tropical northwestern Pacific, the tropical South Pacific and tropical South America. For JJA, the models projecting El Nino-like Pacific SST changes tend to simulate greater future precipitation in the tropical central Pacific and less over the Maritime Continent and around Central America.
Interestingly, the present climate features of the delayed JJA precipitation response to previous DJF Nino3 SST variability also appear as differences in future JJA precipitation changes between the models projecting future El Nino-like and La Nina-like Pacific SST changes in DJF. Compared to the later models, the former models have a tendency to show more precipitation south of Japan and south of the equator in the central to eastern Pacific, and less in the subtropical northwestern Pacific.
CMIP3 model analysis indicates that the projected El Nino-like SST changes are related to the present precipitation climatology of the models in the near-equatorial eastern Pacific for each DJF and JJA season, suggesting the importance of realistically simulating present precipitation climatology in the tropical Pacific for future projections.
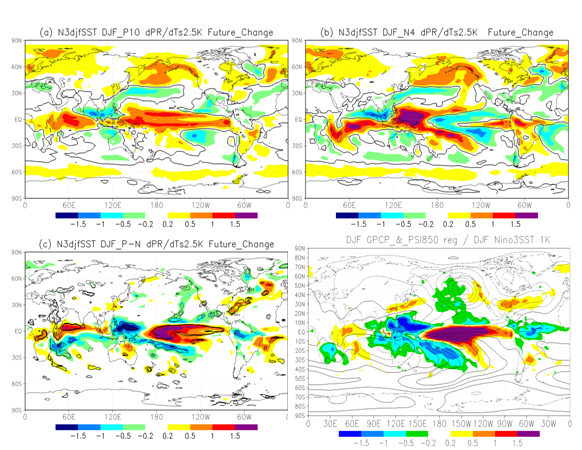
Figure caption: Future precipitation changes simulated by the CMIP3 models (a)projecting El Nino-like Pacific SST changes, (b)projecting La Nina-like Pacific SST changes,
(c) Difference between (a) and (b), (d)Observed precipitation variability related to Nino3 SST variability.
<< To simulate a realistic response of tropical western Pacific precipitation to Nino3 SST varibility >>
Characteristics of the CMIP3 Models Simulating Realistic Response of Tropical Western Pacific Precipitation to Nino3 SST Variability (Tomoaki OSE and Osamu ARAKAWA)
The 20th century simulations from the World Climate Research Programme's Coupled Model Intercomparison Project phase 3 (CMIP3) multi-model dataset are examined statistically using numerical skills to capture the characteristics of the models which realistically simulate responses of the tropical western Pacific (TWP) precipitation to sea surface temperature (SST) variability over the Nino3 region [150W-90W, 5S-5N].
The simultaneous correlation of precipitation anomaly over the TWP region of [90E-170E, 20S-20N] with Nino3 SST variability is successfully reproduced with relatively high skills for June to August (JJA) as compared with those for December to February (DJF) and March to May. The high skill models have common characteristics of realistically simulating the observed largest precipitation response to Nino3 SST variability over the equatorial central Pacific east of the dateline. Furthermore, the realistic simulation of the climatological mean equatorial precipitation west of the dateline seems to be responsible for the realistic response of the TWP precipitation to Nino3 SST variability.
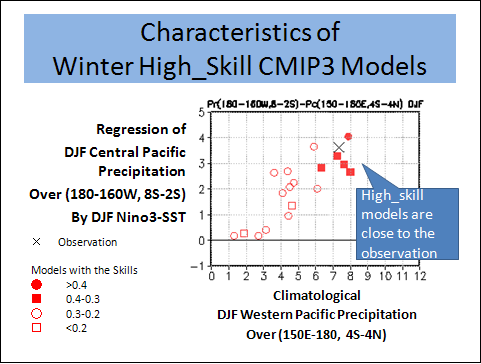
Figure caption: Characteristics of High-Skill Models in DJF (Precipitation Variability and Climate)
A few of the models successfully simulate the delayed response of the JJA precipitation over the TWP region of [90E-170E, 10S-30N] to the preceding DJF Nino3 SST variability with high skills. Those models reproduce the statistically observed features of subtropical northwestern Pacific SST anomaly, precipitation and SST anomalies over the Indian Ocean in JJA following DJF Nino3 SST variability. Another distinctive characteristic of those models is to reproduce almost null correlation of the equatorial central Pacific SST anomaly in JJA with the preceding DJF season Nino3 SST variability.
<< Two types of northern winter atmospheric response to El Nino >>
A Biennially Oscillating Sea Surface Temperature and the Western Pacific Pattern (Tomoaki OSE)
It is found that the appearance of the western Pacific (WP) pattern and the Pacific/North American (PNA) pattern in the northern winter is statistically related to a biennially oscillating sea surface temperature (SST) in the South China Sea (SCS) and associated precipitation variability over the tropical western Pacific in the following way;
(1) When precipitation is strongly suppressed (enhanced) east of the Philippines at the warm (cold) phase of NINO4 SST, the WP (the inverse WP) pattern tends to appear. This is qualitatively consistent with a local Hadley circulation theory.
(2) When negative (positive) precipitation anomalies are small east of the Philippines or when those are shifted westward at the warm (cold) phase of NINO4 SST, the PNA (the inverse PNA) pattern tends to appear rather than the WP (the inverse WP) pattern.
(3) The above variability of the precipitation in the tropical western Pacific corresponds to that responsible for the biennial oscillation in the SCS SST and the neighboring SST.
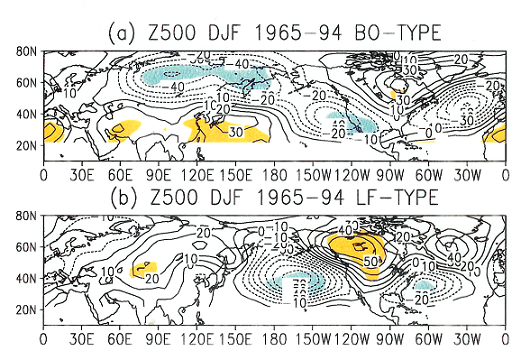
Figure Caption :
(a) Precipitation anomaly composite for inactive precipitation cases to east of the Phillipines during Northern Winter's El Nino.
(b) Except for the other cases during Northern Winter's El Nino. Colors are for 95% significance.
<< How does atmosphere over the summer-continent get warmed up ? - heat budget of Asia summer monsoon - >>
Asian summer monsoon viewed from energy budget (Tomoaki OSE)
The Asian summer monsoon was studied viewed from the energy budget by analyzing the radiative flux budget at the top of the atmosphere and the atmospheric heat budget. (1)The contrast of heat sources in northern summer between land and sea and between the upper and lower atmosphere over land, and (2) atmospheric heat advection moderating these contrasts are summarized as follows;
(1) The net radiative flux at the top of the atmosphere (NET) over Iand dominates that over the ocean in mid and high latitudes during northem summer. The NET land-ocean contrast is created by stratus clouds over the ocean in high latitudes after snow cover mostly disappears over land. Seen from the vertically integrated atmospheric energy budget, seasonal change similar to that of NET is found in sensible heating over land in high latitudes. In mid-latitudes, sensible heating is dominant from spring to early summer, and evaporation is active in late summer. Energy estimated exceeding NET is transporte from the atmosphere to the ocean in high latitudes besides NET in July-August.
Before the onset of the summer monsoon circulation (in April), sensible heating near the surface contributes to increase the low-level temperature over land, especially under the downward motion of Hadley circulation and extratropical stationary waves (lran Plateau and northem China).
(2) After the onset of summer monsoon circulation (in June), the heat source due to precipitation in Southeast Asia dominates sensible heating over the Eurasian Continent. Upward motion balances this condensational heat source.
Strengthened downward motion warms upper-level air over central Asia and sensible heating near the surface is canceled by northerly cold advection. Strengthened warm southerly advection contributes to troposphere warming over the Tibetan Plateau and the northwestem Pacific in the mid-latitudes. Condensational heating in both of the above regions appears to contribute to the strengthening of the lower-level southerly flow.
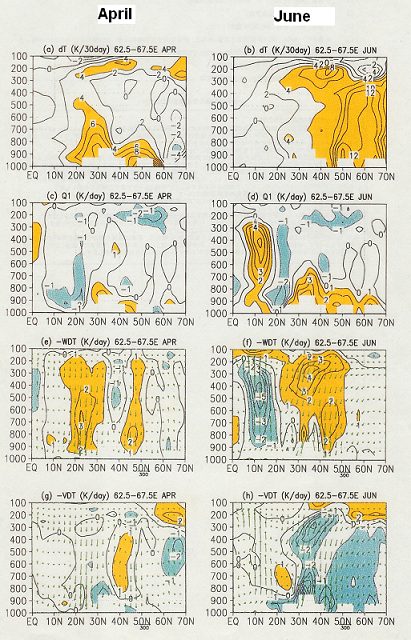
Figure caption: Atmospheric heat budget along 65E in (left) April and (right) June.
From upper to lowers figures, Increase of air temperature, Diabatic heating, Heating due to downward motion along pressure-coordinates, Heating due to meridional winds on constant pressures.
<< Seasonal march of northern summer Asia monsoon - atmospheric response to heating source - >>
Seasonal Change of Asian Summer Monsoon Circulation and Its Heat Source (Tomoaki OSE)
The Asian summer monsoon circulation, especially its climatological seasonal change, was studied as the model response to the prescribed zonal mean field and the prescribed diabatic heat source from the observation. The obtained results are summarized as follows.
(1) During the Asian summer monsoon season, the prescribed deep heat sources in the southern part of Asia form the Tibetan High, the monsoon trough, the low-level circulation over South Asia, and furthermore, the downward motion in the western part of the Eurasian Continent. The heat sources near the surface over central Asia also induce downward motions aloft.
(2) In early summer (June), the deep heat sources in the southern part of Asia tend to form southwesterly low-level flows and upward motion southeast of Japan. Those are considered to be the background for the Baiu formation in East Asia as well as heat lows produced in the southern part of Asia. The mid-latitude heat sources associated with the Baiu precipitation produce a low-level jet south of that.
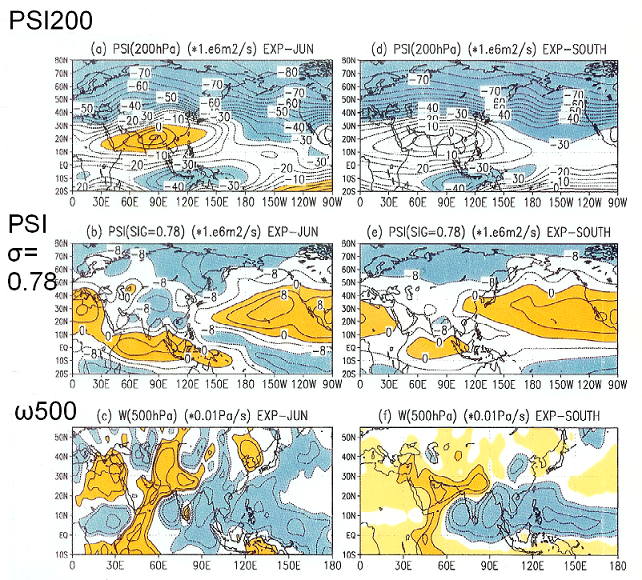
Figure caption: Early summer (June zonal mean climatological field is given) nonlinear model response to the observed climatological June atmospheric heat sources (Right) over the entire globe and (Left) only over the southern Asian region from the northern Indian Ocean to the tropical northwest Pacific.
From upper to lower figures, eddy parts of 200hPa streamfunctions, low-level streamfunctions, and middle-level vertical (pressure) velocities (upward motion is negative and blue-shaded, downward motion is positive and orange-colored).
(3) Climatological seasonal change from early summer (June) to mid-summer (July) is characterized by an air temperature increase in the whole Northern Hemisphere and a northward shift of a weakened westerly jet. When in the model a zonal mean field in June is replaced by that in July, the major characteristics of the seasonal change are obtained qualitatively; low-level jets and upward motion areas in South Asia and East Asia shift from the ocean side of the coasts toward the land side. This change of vertical motion is consistent with the seasonal change of deep heat sources from June to July.
(4) The climatological seasonal change from mid-summer (July) to late summer (August) is characterized by enhanced convective activity in the extended area of the subtropical western Pacific. When deep heat sources in July are replaced by those in August over the western Pacific only, the major characteristics of the seasonal change over the Pacific and the Indian Ocean are obtained. The expansion of the Tibetan High at the upper-level and the Pacific High at low-level over Japan is also simulated by the seasonal change of the western Pacific heat sources only.
(5) The model simulation with the combination of the diabatic heat source for August and the zonal mean field for June is compared with the climatological August simulation. It is indicated that the zonal mean field delayed from its seasonal migration could be related to weak monsoon circulation and the associated precipitation anomalies in the mid-latitudes and the subtropics.
<< Two-type responses of tropical western Pacific precipitation to northern winter's El Nino and the following summer >>
Sea Surface Temperature in the South China Sea -an Index for the Asian Monsoon and ENSO System- (Tomoaki OSE, Yukuan SONG and Akio KITOH)
Interannual variability of the sea surface temperature anomalies (SSTA) over the South China Sea (SCS) is recognized as an index for the Asian monsoon and ENSO system because of its special geographical location for that system. The following results are obtained by the statistical analysis of the observational data.
(1) In the northern winter, the SCS SSTA are quite sensitive to the longitudinal shift of global wind anomalies associated with the equatorial Pacific SSTA. This fact is related to that the SCS SSTA and the neighbor SSTA have strong biennial oscillation.
(2) When the global wind anomalies are shifted eastward in the winter (BO-type years), the tropical eastern Pacific SSTA tend to change in the following spring. On the other hand, when those wind anomalies are shifted westward (LF-type years), the eastern Pacific SSTA tend to be maintained through the year. The associated differences between the BO and LF-type years are found in the seasonal change of the low-level tropical wind anomalies from the preceding summer through winter.
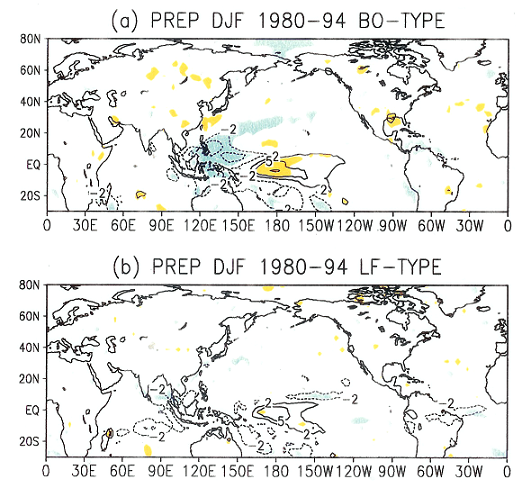
Figure Caption : (a) Precipitation anomaly composite for inactive precipitation cases to east of the Phillipines during Northern Winter's El Nino. (b) Except for the other cases during Northern Winter's El Nino. Colors are for 95% significance.
(3) The northern summer SCS SSTA seem to be controlled by in-situ low-level wind anomalies. Furthermore, easterly anomalies over South Asia and the tropical western Pacific and westerly anomalies over East Asia are found in the lower atmosphere for the positive SCS SSTA. It is also shown that the summer SCS SSTA have a statistical relationship with the equatorial central Pacific SSTA in the preceding winter. This fact suggests a relationship between the summer Asian monsoon and the winter phase of ENSO.
<< Necessary conditions for Eurasian spring snowmass anomaly to be influential in seasonal evolution >>
The Comparison of the Simulated Response to the Regional Snow Mass Anomalies over Tibet, Eastern Europe and Siberia (Tomoaki OSE)
The atmospheric response to the regional snow mass anomalies in early spring over Tibet, Eastern Europe, and Siberia is compared by general circulation model ensemble experiments. The positive snow mass anomalies over Tibet produce the largest cooling anomalies in the atmosphere from spring to early summer. Almost no significant forcing anomalies are systematically formed by the snow mass anomalies over Eastern Europe and Siberia.
The model experiments show that the cooling source over Tibet works significantly to delay the seasonal transition from spring to summer in the Northern Hemisphere. It is confirmed by the simulated weak Asian monsoon; a weak lower tropospheric monsoon jet in South Asia, a weak large-scale divergence center at the upper troposphere in Southeast Asia, negative lower-layer geopotential height anomalies in the North Pacific and the North Atlantic, and the weak Walker circulation in the equatorial Pacific are simulated. The above noticeable response of the atmosphere to the snow mass anomalies over Tibet is associated with the following characteristics of Tibet as compared with Eastern Europe and Siberia;
(1) The small snow melt speed over Tibet, probably due to its high elevation, maintains the early spring additional snow mass until almost the end of the climatic snow-melt season.
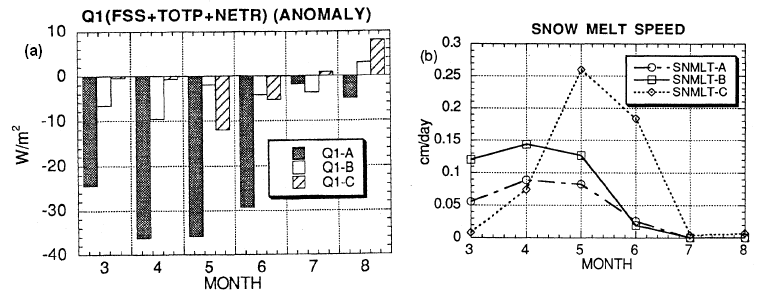
Figure caption: (Left) Total atmospheric heat source (sensible heat flux convergence + condensational heating + radiative heating) deviation from the control experiment, (Right) Climatological snow-melting speed over Tibet (A-region), East Europe (B-region) and Siberia (C-region).
(2) The snow albedo is effective because of large solar incidence and relatively small cloudiness over Tibet.
(3) The existence of the anomalous snow cover works to cut the upward sensible heat flux rather than the evaporation over Tibet because of its dry ground condition.
(4) The dry ground over Tibet makes it possible that all the anomalous snow-melt water is not drained as runoff, but a part of it is stored in the ground.
(5) As pointed out by many researchers, the Tibetan Plateau plays an important role in the establishment of the Asian monsoon.
The above conditions (1)-(5) for the effective snow mass anomalies are found in the model Tibet, but these conditions would be satisfied by the real regions where the snow mass anomalies affect the atmosphere efficiently. The extended atmospheric responses are found in May for the East European case and in August for the Siberian case. These are accompanied by significant ground condition anomalies in northern Eurasia. Those ground condition anomalies are not directly related to the successive ground condition anomalies followed by the anomalous snow mass melt, and seem to be created after the water and heat of the initial snow mass anomalies are supplied into the atmosphere.
<< What is the effect of representing cloud ice issued from cumulus in AGCMs ? >>
An Examination of the Effects of Explicit Cloud Water in the UCLA GCM (Tomoaki OSE)
The effects of explicit cloud water are examined by adding the mixing ratios of cloud ice and cloud liquid water to the prognostic variables in the UCLA GCM. A simple cloud model and the published radiation schemes are incorporated in the model. Besides a grid-scale condensation process, the other source of cloud ice and cloud liquid water is the detrainment from the cumulus. The detrained cloud ice and cloud liquid water are obtained by the microphysical calculation in the Arakawa-Schubert cumulus scheme. The results are compared with the observations, concerned with cloudiness, planetary albedo, OLR and the dependence of cloud water content on temperature. The dissipation process of cloud ice with use of a realistic ice fallspeed produces realistic simulations.
Cloud ice detrained from the cumulus simulates anvil clouds in the tropics. These clouds coexist with those due to grid-scale condensation, such as thin cirrus. Even at low temperatures, anvil clouds have dense cloud ice content which is one to two order larger than that of clouds due to grid-scale condensation. Anvil clouds produce low OLR, high planetary albedo and strong shortwave absorption in the tropical convective regions. Grid-scale condensation is active in moist environment due to the sublimation of the detrained cloud ice, and produces a net positive heating rate in the upper troposphere. The sublimation and melting of cloud ice, and the evaporation of rain produce a net cooling rate in the lower troposphere.
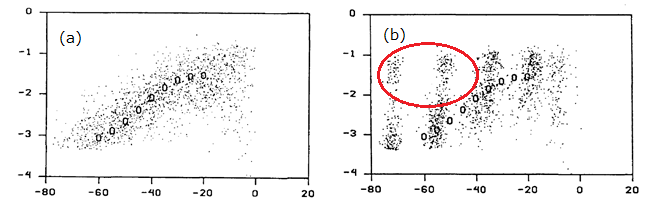
Figure caption: Dependence of cloud ice content in high and mid-latitudes (ordinate: log10(g/m3)) on air temperature (abscissas: centigrade) , where the symbol of "o" is from observation and others are simulated samples.
(a) in high and mid- latitudes, (b) the same as (a) but for the tropics.
Presentation
- Sixth China-Korea-Japan Joint Conference on Meteorology October 24-25, 2013
<< Application of AGCM to Future Projection>>
- WCRP Workshop on Seasonal Prediction, Barcelona Spain June 4-7, 2007